Stories
When is a near flat trend a good trend? Right now.
Keeping drug trend in check is tough. When we can show our clients a Medicaid drug trend that’s virtually flat – three years in a row – that’s a huge victory
July 22, 2019Pushing back against rising trends
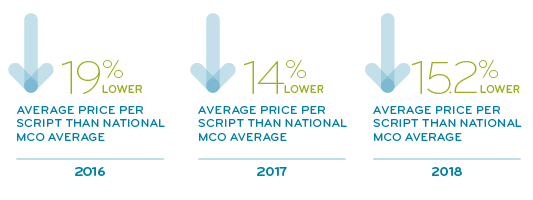
In a time where drug costs are rising at unprecedented rates, maintaining solid drug trend numbers is no easy task. Since 2016, our data show we’ve stayed on top of our game by maintaining an essentially flat Medicaid drug trend¹ (despite a 6.5% national Medicaid drug spend increase²). At the same time member satisfaction scores have stayed high.³ This shows that we have the tools to manage Medicaid costs consistently and effectively:
- Through the use of sophisticated fraud, waste and abuse programs, we removed $17.5 million of inappropriate use since 2016
- By encouraging the use of generics (87.4% GUR in 2018), we provide cost effective care for more members
- Since 2017, we negotiated drug and network savings of $65.5 million to provide members with the medicines they need at a lower administrative cost
Effective clinical programing tailored to the unique needs of the Medicaid population has reduced program costs $390 million since 2016.
Total drug trend for 2016-2018: 0.3%¹
Making a difference in the Medicaid space
The rise in drug costs isn’t expected to slow anytime soon. But we have the people and tools in place that will help us to evolve along with the Medicaid marketplace, because our main purpose is to get people the medicine they need to feel better and live well.
- Trend methodology Represents the change in 2016 vs 2018 for Prime’s Medicaid book of business for Total Costs (plan + member PMPM) inclusive of network discounts + tax + dispensing fees minus total supplemental rebates. Calculations include Medicaid populations with 12 months of 2016 and 2018 data. Geographic and population weighting was applied to book of business calculations using the 2018 state-by-state population proportions. Trend analyses in this report were prepared and reviewed by Prime’s actuarial team.
- Internal Prime analysis and available Medicaid Managed Care comparison data retrieved from Medicaid.gov state drug utilization database. Data through 2018.
- Prime internal member satisfaction survey. Member overall satisfaction with their Medicaid drug plan: 92%
Related news
Stories
July 22, 2024
Introducing the latest issue of our medical and pharmacy benefit management report
The summer 2024 issue of the Magellan Rx Report provides insights on the industry’s most groundbreaking managed care solutions in some of the most complex areas of health care
Stories
July 18, 2024
Specialty drug trend forecasted to drop for employer groups, clinical experts say
Introduction of Humira® and Stelara® biosimilars contribute to continued decline in the autoimmune – anti-inflammatory trend
Stories
July 16, 2024
Prime/Magellan Rx earns top score on the Disability Equality Index
For the second consecutive year, Prime Therapeutics/Magellan Rx Management received a score of 100 on the Disability Equality Index®, which benchmarks disability workplace inclusion